Beginner's guide
How to use GEX BASIC
No prior knowledge needed. We go through the screen step by step, with real numbers as examples, and finish with a practice day you can replay yourself.
Three words you need
- Spot
- The index price right now, for example SPX 7764.27.
- Strike
- An option's exercise price. For SPX they usually come every five points: 7760, 7765, 7770 and so on.
- Gamma exposure (GEX)
- How much the option sellers (dealers) must buy or sell of the index to stay hedged as price moves. A strike with a lot of GEX becomes a level where price often reacts.
A simple picture: large levels with positive gamma act like shock absorbers – dealers trade against the move, so price slows down. With negative gamma they trade with the move, like an accelerator. For the why, read What is GEX? – but you can use the dashboard without the theory.
Step 1 · Choose what you look at

- View: Single is one ticker, large – start there. Multi, Nodes and Scanner are covered further down.
- Ticker: the index or ETF you're looking at. Pick SPX if unsure.
- Expiry: which options the levels are computed from. 0DTE = options expiring today, 1DTE = the next session, 90d = everything within 90 days combined.
- Market status: the box next to the logo says whether US markets are open and how long is left.
- Icons on the right: bell = alerts, two squares = copy levels, camera = save an image, keyboard = shortcuts, gear = settings, person = your account.
Example
It's Tuesday 22 September. The button 0DTE · 09/22 means options expiring today, and 1DTE · 09/23 is Wednesday's. If you trade options that expire the same day, choose 0DTE. For the bigger picture, choose 90d.
Step 2 · Read the regime line – your first glance

The line above the chart sums up the situation in one line. Read it first, every time.
- POSITIVE GAMMA (green): spot is above zero gamma. Moves tend to be damped and price often bounces between the levels.
- NEGATIVE GAMMA (red): spot is below zero gamma. Moves tend to be larger and faster.
- The distances are points to each level. + means the level is above spot, − below.
Example
NEGATIVE GAMMA · 0.08% below zero gamma · +10.73 to major + · +0.73 to major −
- Price is a little below zero gamma, so negative gamma – expect moves that can be larger than usual.
- Major + is 10.73 points above.
- Major − is only 0.73 points above – price is right at a wall.
Step 3 · Find the levels on the chart
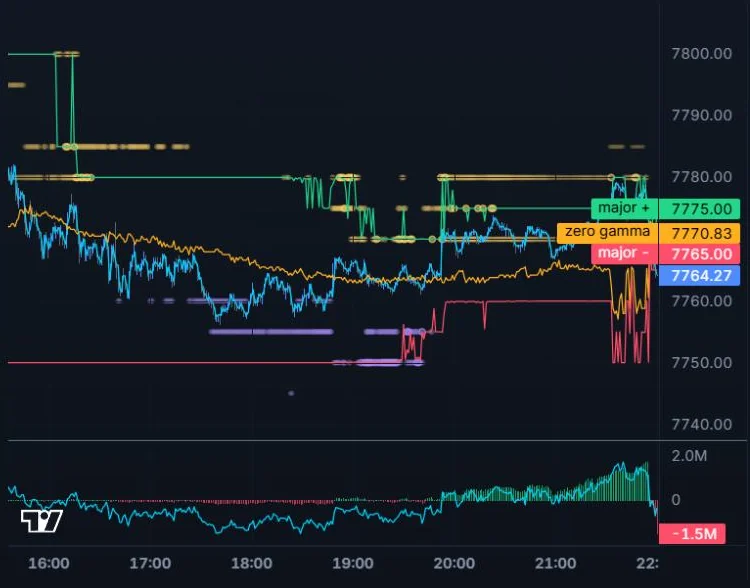
The chart shows price through the day and the three most important levels. Each level has a label on the right with its current value.
- Blue line or candles: price (spot).
- Green line – major + (call wall): the strike with the most positive gamma. Price tends to slow down here on the way up.
- Red line – major − (put wall): the strike with the most negative gamma. Price often reacts here, and if it breaks the move can speed up.
- Orange line – zero gamma: the line between positive and negative gamma.
The lines have history: when the green line jumps to a new level, the wall has moved. Dotted lines marked prev show where the levels ended yesterday.
Example
Spot 7764.27 · major + 7775 · zero gamma 7770.83 · major − 7765. Price is below zero gamma and just under major −. If it gets above 7770.83 the market turns positive gamma, and the next brake is major + at 7775.
The levels aren't always in the order major + on top and major − at the bottom – they sit where the exposure actually is.
Step 4 · The GEX profile – the bars on the right
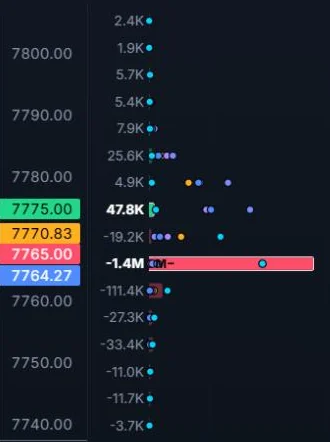
To the right of the chart is one bar per strike, lined up with the price axis – so you see at once which prices carry a lot of gamma.
- Length: the longer the bar, the more gamma at that strike. The number on the left is the value.
- Color: green for strikes above zero gamma, red for strikes below. So the color tells you where the strike is, not whether the value is positive or negative – the number tells you that.
- White outline: major + and major −.
- The dots: where the bar was 1, 5, 10, 15 and 30 minutes ago. A bar far from its dots = the strike has changed a lot just now.
Example
The bar at 7765 shows −1.4M and is by far the largest. It has a white outline, so it's major −. If its dots sit far from the end of the bar, it has grown over the last minutes – the wall is getting stronger.
Step 5 · The sidebar – the numbers
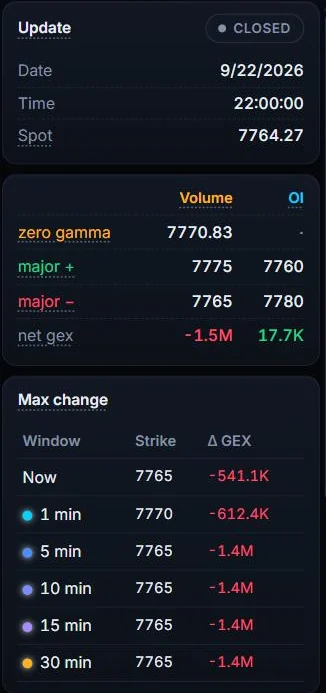
- Update: date, time and spot of the latest snapshot. The badge says whether the data is fresh (green), delayed or the market is closed (gray). If the data is delayed while the market is open, an amber line above the chart says so too.
- Since yesterday (OI): where the open-interest walls are now, next to where they ended the previous session – so you see at once whether they moved overnight.
- Volume and OI: the levels as numbers, computed two ways. Volume is based on today's trading and changes all day. OI (open interest) is based on yesterday's open contracts and is set before the open.
- Max change: where the most is happening right now – the strike whose gamma changed most in each time window.
- Events: wall moves, regime flips and touches as they happen. The 1st touch of a level tends to matter most.
Example
Major + is 7775 by volume but 7760 by OI. The morning picture (OI) had the wall at 7760 – today's trading has moved it to 7775.
The row 1 min · 7770 · −612.4K in Max change means: over the last minute gamma changed most at 7770, and it fell by 612,400.
Step 6 · The node map – the levels between the lines
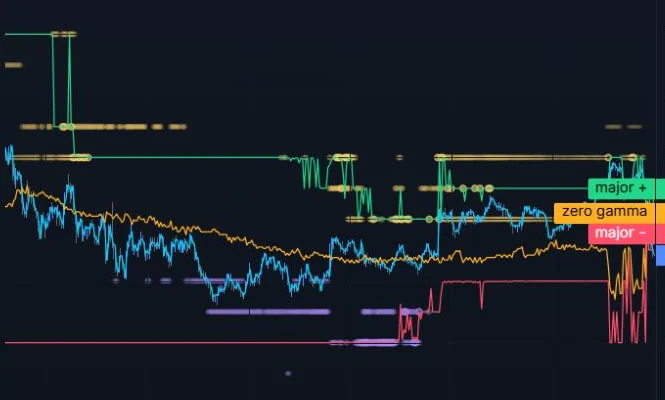
The dots behind price show other strong levels, minute by minute – the ones that aren't already major + or major −.
- Gold = positive gamma (tends to slow price). Violet = negative gamma.
- Bigger dot = stronger that minute. Brighter = strong next to the last half hour too. A ring marks the minute's largest node.
- A band of dots means the level is holding. If the band jumps the level moved; if it fades the level is going away.
Example
A gold band that stays at 7780 for an hour is a level that isn't major +, but where price may slow down.
The key in the chart's top left shows the colors; close it with ×. Turn the map off or change its expiry under Settings → Panes & lines → Node map on chart.
Step 7 · Set an alert so you don't have to watch
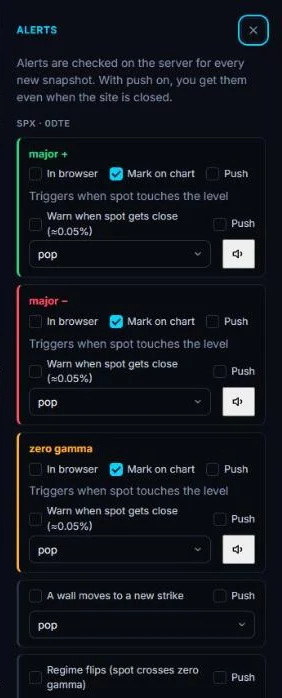
- Click the bell (or press A). Alerts apply to the ticker and expiry you're looking at.
- Pick a level: major +, major − or zero gamma.
- Tick In browser – you'll hear a sound and see a notification when spot touches the level.
- To know before price gets there, tick Warn when spot gets close – it fires when spot is within about 0.05% of the level.
- Choose a sound and press the speaker to test it.
- To see afterwards where the alert fired, tick Mark on chart.
- With Pro you can tick Push and get the alert on your phone, even with the site closed.
The browser asks to allow notifications the first time – say yes. The tab can stay in the background.
Step 8 · Replay and practice

Under the chart you can play the day again. It's the best way to learn – you see how the levels behaved before price moved, without risking anything.
- The slider: drag to go to a time. Play plays it back, and the menu next to it sets the speed (1x–10x).
- LIVE: takes you back to now.
- Time range (on the right): last 1 h, 3 h, the whole session or any date.
Practice: a full trading day
This is how a day can look. Times are New York time, with Central European time in brackets (normally six hours later).
- 08:30 (14:30) – prepare. Open SPX, 0DTE. The open-interest levels are ready. Note major +, major − and zero gamma from the OI column in the sidebar.
- 09:30 (15:30) – the market opens. Read the regime line. Positive or negative gamma?
- Set alerts on major + and major −.
- When an alert fires: check the regime. In positive gamma price tends to slow at the wall; in negative gamma it can push through. Check Events too – is it the first touch?
- Watch for changes: if a wall moves (Events) or a new strike lights up in Max change, the picture has changed.
- 16:00 (22:00) – after the close. Replay the day at 10x and see how price behaved at each level. That's how you build experience.
Common mistakes
- Treating a level as a guarantee. Levels show where price reacts more often – not what will happen.
- Forgetting the regime. The same wall behaves differently in positive and negative gamma.
- Mixing expiries. 0DTE levels are for today's options. Check which expiry is selected before reading a level.
- Reacting to every flicker. Levels update every second. A wall move only counts once it has held for a while – Events only shows confirmed moves.
- Watching outside market hours. Levels only change 09:30–16:00 New York time.
The other views
- Multi: 2 or 3 tickers of your choice side by side - pick them and the number of panes right on the Multi page.
- Nodes: a table with one row per strike and one column per expiry. Strong levels light up, and the box on top names the shape (for example Range or Scattered) – see the glossary.
- Scanner Pro: every ticker in one sortable table – regime, distance to the walls and the latest wall move.
Settings worth knowing
- Prices in: Index / Futures – show everything in ES/NQ futures prices if you trade futures.
- Chart type – line or candles.
- Color preset – a colorblind-safe blue/orange palette.
- Time zone – New York, Stockholm or UTC.
Keyboard shortcuts
1 2 3 expiry · T Single/Multi · N nodes · K scanner · ← → ticker · A alerts · S settings · C copy levels · E save image · L live · ? help
This guide is education, not investment advice. Your trading decisions are your own.